This entire plan is based on models that do not align with what we are seeing. The graph on slide two[1] of the official CA govt plan shows hospitalizations With Intervention rising exponentially, exceeding our hospital capacity in early June. The actual new infection data shows that the rate of new infections has been decreasing since at least 4/4 [2], meaning that the graph of active hospitalizations should be a bell curve with a maximum value of ~10,000 on ~4/20.
The mismatch between their models and the observed data does not engender confidence.
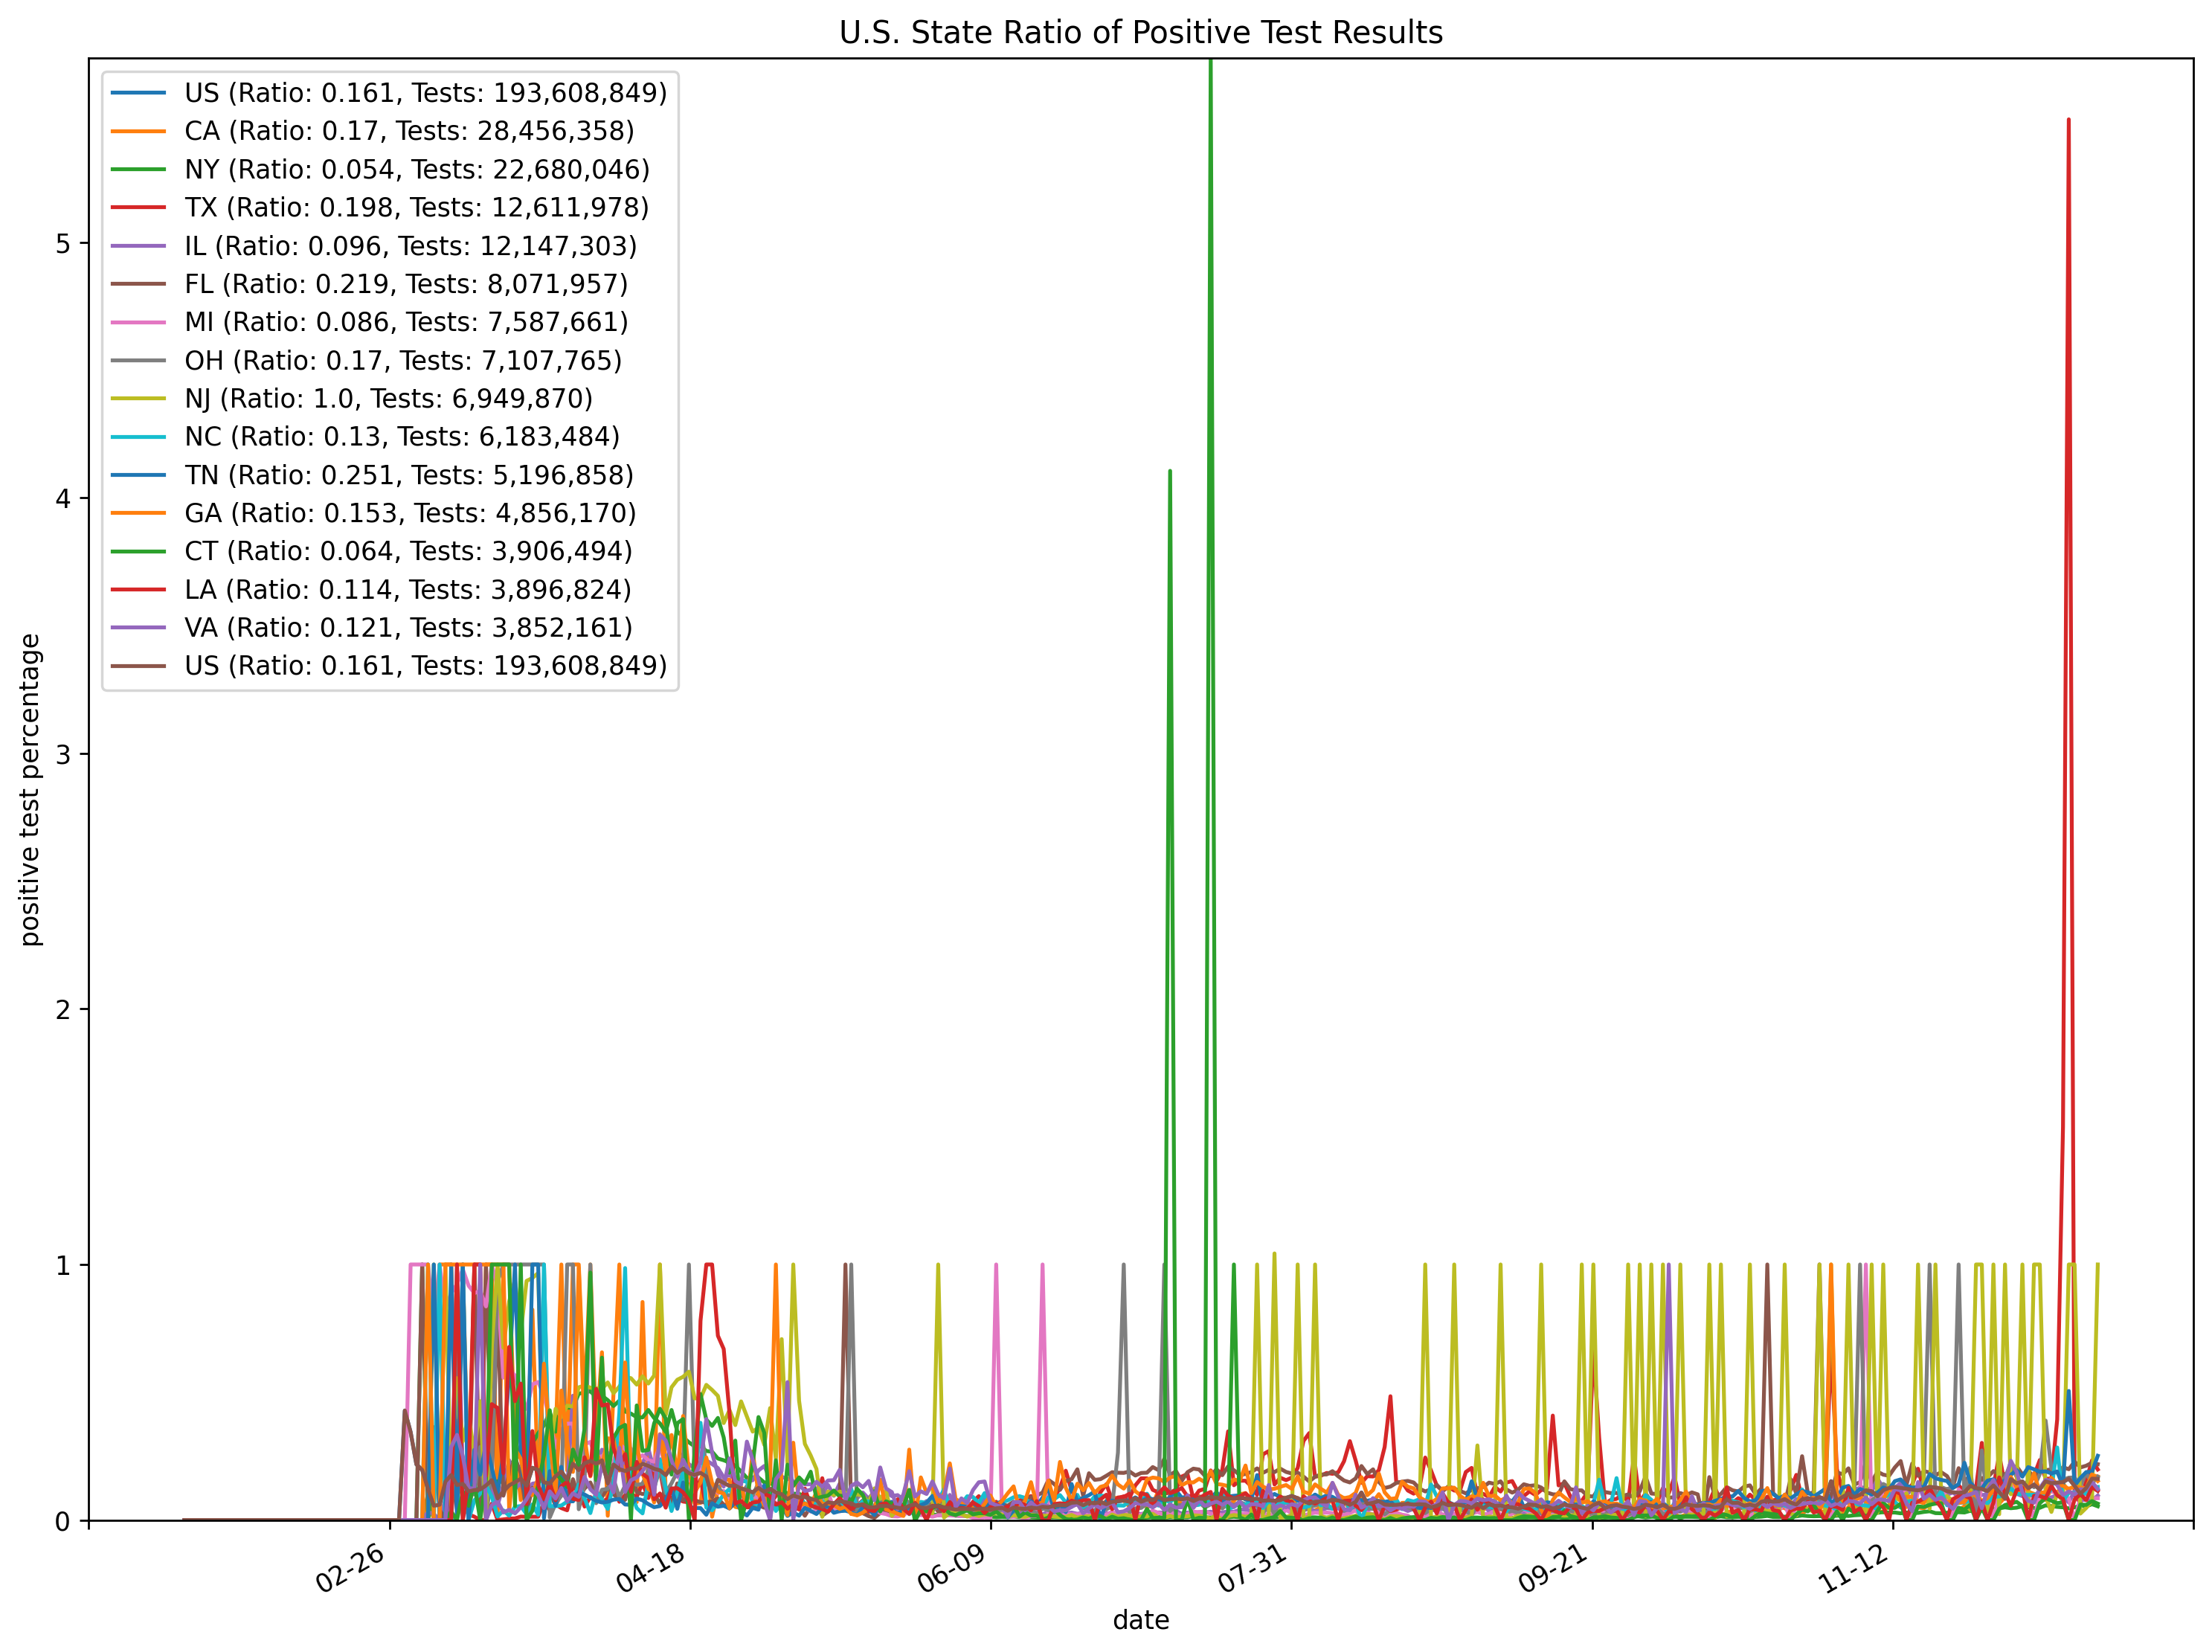
Something weird happened in California, where 20% of their tests were coming back positive, then all the sudden 04/04/2020 they started seeing <10% positive tests:
I can't speak to the hospitalization levels, but I suspect people are avoiding the hospital. My roommate decided not to get tested and stay home, even though he was having difficulty breathing. He seems past it after a couple weeks.
>Something weird happened in California, where 20% of their tests were coming back positive, then all the sudden 04/04/2020 they started seeing <10% positive tests:
This is not surprising. When tests were scarce, tests would be rationed to those most suspected of infection.
The cases reported per country, or state are only a narrow window into what is actually happening. The most advanced medical testing company in the world, Roche, is Swiss-German so Germany's testing capability relative to most countries is off the charts. Combined with a highly distributed, yet also highly co-ordinated health care system they have been ahead of the curve in testing on every conceivable metric. As a result they have reported relatively high case totals, because they have been doing mass testing for a long time, but very low death rates because this enabled them to effectively isolate cases quickly.
As countries increase their testing capacity it is quite possible some countries (or states) will end up eventually reporting accelerating numbers of diagnoses even if the actual new case rate in the population is falling.
One way to mitigate that is to report only cases requiring hospital admission. This isn't ideal by any stretch, but is a reasonable proxy for the spread of the virus and at least gives a good indication of the impact on the health care system.
> Data from 3 epidemiological studies in the United States show that as many as half of people with COVID-19 infections in care homes were asymptomatic (or pre-symptomatic) at the time of testing
> Data from 5 European countries suggest that care home residents have so far accounted for between 42% and 57% of all deaths related to COVID-19.
But hospital admission cases depends on perceived hospital resources too... if people think going to the hospital is worse than staying at home, or impossible, that will distort conclusions also.
That's true, but is mainly a problem when comparing one country or region with another. Within a region, assuming a roughly stable general perception of hospital capability, it should till give a reasonable indication of the relative rise and fall in numbers of severe cases. I don't know, it's a really hard problem.
I can't figure out what you mean, can I go someplace to get tested and put my mind at ease that I'm not about to die or kill my familymembers? That's the only "relative" that matters here.
This whole thread is about California's roadmap. LA County is something like 25% of the state. Why stop at the USA? With people moving between places, outbreaks anywhere will matter until there's a reasonable vaccine/treatment.
Assuming that's the Abbott 15 minute test, there's only going to be 50,000 of those a day for the near future (and it seems less than that in the immediate future).
That's a big chunk on top of current testing, but probably not enough to make it easy to move forward with a testing based strategy.
When testing is scarce it is used as a clinical tool to help make decisions about treatment. For example: patient has pneumonia. If its bacterial pneumonia a course of the right kind of antibiotics will be very helpful. If its COVID, those antibiotics won't do anything, and the patient may not get the therapies they really need.
Once testing becomes more available, doctors use it to rule out COVID even on patients who aren't very sick, to help make sure they those patients aren't spreading it, instead of just making treatment decisions.
Ideally once testing capacity gets high enough we could start testing every contact of an infected person, or just randomly sample people.
Additionally, notice that the orange data points (actual hospitalizations) are significantly under the "With Intervention" plot. So why even include the slide? Clearly the assumptions behind the "With Intervention" plot do not match reality TODAY, let alone in a few weeks.
Not a good sign if people are making actual decisions based on this.
> Clearly the assumptions behind the "With Intervention" plot do not match reality TODAY, let alone in a few weeks.
I feel like I’m taking crazy pills with the way people are talking about this whole thing still being out of control, when data shows the situation is even better than the most optimistic models were predicting. And by that I mean, pretend I was on HN 3 weeks ago predicting 25K deaths in the USA by today. I’d have been downvoted into oblivion and told I was delusional. But here we are.
Clearly NYC was hit far harder than the rest of the country, but it seems like every state and municipality is simply basing their models on NYC case numbers scaled by population. I don’t get it.
I don't understand what you're suggesting, that California should ease up faster? It seems to me that reality being better than models had predicted is more the result of everyone flying blind due to lack of testing... California has probably been lucky that it turned out its infection was lower than New York's turned out to be. It is just hard to make a model starting from extremely shitty and noisy base data about facts on the ground, but someone still has to make very difficult public health decisions based on the best models available.
> I feel like I’m taking crazy pills with the way people are talking about this whole thing still being out of control
A week ago, I remember reading how the Bay Area was bracing for a bracing for a surge and it was the calm before the storm. The Santa Clara county covid-19 dashboard told a different story: day-over-day, new cases were roughly the same for the past two weeks. 2+ weeks into the lockdown, there was obviously no surge coming.
Isn't this just California being in the "3.6 roentgen, not great, not terrible" phase? I.e. number of new cases reported is limited by the number of tests that are able to be made?
Every region (and almost every country) is generally believed to be severely undercounting cases because of limited testing. There's not much reason to believe the problem is worse in California than elsewhere, and a severe surge would be evident in hospitalization and death rates no matter how bad testing is.
In mid-March we were told that we are "10 days behind Italy" and shelter-in-place is not to stop the spread (already too late for that), but to give hospitals a bit of a breather before the surge of critical cases and the Death Wave that follows. That was the justification for such extraordinary measures as a state-wide lockdown.
It's mid-April now. Where is the Death Wave? Either this virus is much less infectuous than it was touted, or much less deadly. Or both.
Sweden never locked down. Denmark is opening up after a lockdown. Italy that was touted as the prime example of hell on earth, had ~21,000 people died by official count. Even if it was undercounted by 50%, that's roughly 40,000 people, mostly elders on their last breath, out of country of 60 mln. And that's the worst case so far, in the world of 7 billion people.
Disregard all that, we're still being told daily that it's "war zone", the zombie apocalypse is just around the corner, etc. Only Big Brother like surveillance is going to save us. The lockdown is not an extraordinary measure anymore, it was an absolutely necessary first step, and now we have to take it further. Much further.
I wonder what it felt like for people in 1932 Germany.
Sweden didnt lock down and as a result has around TEN TIMES more deaths than its neighbours, and the death toll is raising by hundreds per day, when its hovering around 10 with Finland and Norway. I don't think you want to give Sweden as a good example.
Wikipedia says 1,200 deaths so far in Sweden. Sure that might be ten times more than in Finland and Norway but given the dire predictions of two months ago, and even more dire predictions of a month ago, you'd expect this number to be ten times higher than it is now, or a hundred times. What about exponential growth and stuff? In a country with no lockdowns this disease should go rampant, right?
1,200 people dead of 10.3 mln is 0.012% of the populace. Not good but not scary either, for the Worst Pandemic Of Our Lifetime.
I think there was genuine concern that the quarantine as implemented would not be enough. You can see lots of stories locally wherever you are about how people aren't obeying the order. Italy was still in a lot of trouble despite having had some quarantine measures in place. Hindsight shows the quarantine was effective enough to get numbers down. The US, despite reacting too late, did lockdown fully relatively quickly.
I would agree that modeling after NYC seems like a bad idea given the lack of density and public transportation. On the other hand, Michigan looked pretty exponential, and as the lagging cases came in from other states, they also began to look fairly exponential as well. Despite cases staying elevated for now, the exponential growth has died down.
The US missed the worst of hospitals being overrun and it running away in multiple cities.
>The US missed the worst of hospitals being overrun and it running away in multiple cities.
I want to add ", so far" to the end of that sentence. I do not hold hope that this will be true as we fight among ourselves to reopen various portions of the country/economy.
> I do not hold hope that this will be true as we fight among ourselves to reopen various portions of the country/economy.
But things won’t be the same after reopening as they were before. People will be wearing masks (I see a lot of that already), keeping distance, etc. Couple that with common sense restrictions like “keep the elderly and sick at home”, “no big public events”, “no sporting events”, and “lots of restaurants have gone out of business”, it’s clear the opportunity for infection spread will be lower.
I know it's folly but I'm trying to follow the logic here. Newsom and Cuomo, who won their offices fairly easily in their respective elections, seized on a plan to drastically hurt the economies of their respective states. Because, being the ones who took charge of the situation, that would gain some intangible leadership points that would increase their chances of winning their next elections despite the inevitable severe unemployment and budget shortfalls that would much more certainly sink their chances.
Not sure if it is folly for me to try and answer here (no idea if my reply is going to be visible). Thank you for trying to listen anyway.
There is no need to look for malice when there are simpler explanations. No, I do not think Newsom and Cuomo were actively trying to hurt their states' economies; what I said is that they are using the present crisis to advance their political goals _disregarding_ economic fallout. And you are telling it exactly: they are already seen as "taking charge of the situation" while the federal government was "doing nothing". I've seen Newsom being called the savior of the state (nation is the next step, yes) in press and here on HN. Contrast that with what WA state governor was/is doing - I don't even know his name!
I wouldn't try to make projections regarding chances for winning elections; something tells me though that severe unemployment and budget shortfalls are going to be blamed on someone else like federal government failing to provide relief, etc etc. There are all kinds of ways to spin the situation, I would leave that to professionals. There is going to be plenty of them hurting for work.
I live in California, in a smaller rural community way outside Bay Area. It hurts looking at the devastation this lockdown causes: boarded restaurant windows, closed businesses. It hurts listening to the local pediatrics calling us twice a day begging to schedule a virtual check-up "appointment" for kids basically so that they could bill our insurance and get paid _something_. It hurts when I stop by a grocery store and register clerk is happy just to see someone shopping so he could keep his job a little longer. I still have my cushy IT job but I don't have many illusions about keeping it for long if this goes on.
And all this carnage is for what? The latest numbers on Wikipedia state 128,000 deaths worldwide; you know, that's not very impressive for a zombie apocalypse. 760 people died in California so far. In mid-March we were told that California is 10 days behind Italy, and it's going to be hell in here soon. A month later, where is it?
Now take this "roadmap" that Newsom published yesterday. Literally the first bullet point talks about total Big Brother style tracing and monitoring as _necessity_ to even _think_ about lifting restrictions. You sincerely want me to believe all this is done for the sake of us plebe Joes?
I think again you are misunderstanding some severe things. Daily cases are flatlining now yes, but what happens if we open things up again? Why do you think we won't go down an expontential growth track just like before the lockdown?
You're literally saying "hey its not that bad, look at how good the numbers are while we are all staying home! Oh btw, can we stop staying at home?" Do you not see the inconsistency there?
> I think again you are misunderstanding some severe things.
No doubt that I am misunderstanding some things. A lot of things, more likely. Severe? That depends.
If you look at the numbers, they never did fit in the narrative pushed on us. Yes this virus is not just like flu, it is way more dangerous for specific cohorts of at-risk people. Key here is: for specific cohorts. Not for everybody. Why is everybody's life being crippled right now to save the few? Why cannot we quarantine people at risk instead of everybody? There is a wide spectrum of possible options between doing nothing and keeping everybody under house arrest.
Have you ever been laid off in the middle of an economic collapse? I still have my job but I don't think I'm going to keep it for long. And when the day comes I'll have to choose between paying ~$2,500 a month to keep my existing health insurance coverage in the middle of a pandemic, or keeping food on the table. No social healthcare here.
No, it's not about numbers looking good while we're enjoying our stay at home. It's about trying to weigh the risks and being rational instead of "saving lives at all costs". The costs are already staggering beyond belief.
Because it does not make sense to introduce delays to stiffle discussion. Throw-away accounts are used to say things one does not want associated with "main" account; in my case the "main" account is easily doxxable and I knew the things I wanted to say are not going to be popular. I don't care if site mods have access to the logs and can use IP address to add 2 and 2; I just don't want that post above to be associated with my real name forever, via simple google search. I'll have to look for a new job soon, if layoffs continue at the present pace.
I would be happy to have this discussion face to face without having to hide behind an anonymous account but the rules for in-person debates do not apply on the Internet forums.
In rare cases, it allows useful contributions or participation involving someone who has never used Hacker News before, but summoned to participate because the discussion involves them.
There should be a flag that hides new users by default... but consider carefully if you really want to be that person that makes use of such a feature lol
I'd add that it's essential for throwaways, which are sometimes necessary for open discourse depending on the account and topic. Many highly active HN accounts are semi-professional, linking to off-site profiles.
The green seems to make for a good cautionary flag though.
The IHME model is proving to be wildly inaccurate on the downslope due to bad data coming out China. Their projections will continue to creep up in terms of deaths over the next few weeks because the predicted drop offs won’t be happening, sad to say.
If you want to see examples, check out their predictions on Italy. Their figures have been underestimating by over 50%, and the gaps will widen each day over the upcoming week. Heck, the ranges for the last few days have been outside their confidence interval.
A significant portion of this probably is compliance, but I'm with you completely on "the numbers out of China, particularly at the tail end are farcical". There was a drop off a cliff in cases.
I think the point of the plot is to suggest that intervention efforts are being quite successful relative to expectations at the time the "With Intervention" model was generated.
The brighter dashed line is there to show what happens if intervention is disabled completely.
I really like that the milestones are placed as questions, rather than dates. It is the right way to message the unknown.
This is ridiculous criticism. There are so many unknowns with this virus. We don’t know how many people have it, how fast it is spreading or what the mortality rate. Everything is a fairly rough estimate.
It turns out that social distancing is working better than expected, or the virus isn’t as contagious as expected, or slightly less severe than expected. That doesn’t mean the lockdown was the wrong thing to do, or that it isn’t still necessary. What it does mean is that we’ll be able to start easing restrictions as the hospitalizations continue to drop — and perhaps we can stop it completely with testing and contact tracing.
The line is the average of high and low estimates. The issue we are dealing with exponential growth so 1/10th x to 10x makes it look like the estimate is wildly off even when it’s surprisingly accurate.
Further, these estimates are much older than the data so showing their accuracy is useful.
Why should infections follow a bell curve? Shouldn't it be the derivative of a the logistic curve, which should be approximately exponential on both ends. I don't see how a quadratic should show up in the exponent; either mathematically or epidemiologically.
That's a good question. If control measures are undertaken to "flatten the curve" down to the capacity of the medical system, we'd expect to see new infections per day and deaths per day level out, maybe decline a little, but not decline a lot. Which is what the actuals show for the areas worst off.[1]
At some point, there's saturation, and "herd immunity". For this virus, that's somewhere in the 60%-80% range of the population. US population is around 333,000,000, so saturation is somewhere above 200 million.
We're nowhere near that. Current known US total cases are nearing 2 million. Current estimates of undetected cases are in the 80% range, so current total cases is probably around 10 million. So about 20x more people have to get sick before herd immunity. That's well over a year away.
Fair. But the curves on the document referenced above are not epidemic curves. They’re unbounded exponential growth curves. My criticism of the report stands.
The exponential curves are somewhat useful early in an outbreak. It's confusing right now because some places are still "early" and some places are way past the point where those curves are descriptive. So they won't describe NYC at all but they're still somewhat working nationally.
It seems like both the perception of and response to this pandemic are not reflective of reality. What am I getting wrong here?
- Around 200 million Americans will eventually get it, barring extraordinary events (like a vaccine arriving in 6 months). We cannot change this.
- Around 0.5% will die, overwhelmingly those who had a low remaining life expectancy to begin with. This is a much larger body count than most people seem able to accept, but also much less dangerous to the average American than many believe.
- All we can do is alter the timetable to keep the hospitals functioning, which has been done successfully in many places throughout the world albeit at great cost.
There's both good news and terrible news in those facts but none of it really seems to be in the consciousness of the public or of leaders, whereas "oh no you can maybe get it 8 hours after a guy sneezed in a lobby" is everywhere. Along with "everyone who stays at home is a hero" as we set ourselves up for a second Depression.
The death rate is 0.5% IF there's really good medical treatment. If there isn't then not only does the death rate from the covid go up but so do death rates for every other condition requiring medical treatment. And not only during the pandemic but for a some time afterwards as the health system recovers. That's not counting those who survive but have some form of permanent damage.
The way to avoid that is to at least spread out the impact over time. Telling people it'll be okay leads to no one listening and the health system collapsing. That's human nature. Telling people it's the apocalypse means most listen and the health system survives. Welcome to humanity.
I'm just very skeptical of this kind of noble lie. If authorities are known to tell people what's convenient for them to believe rather than what's true, is anyone going to end up listening to them in the end?
Agreed, it'd be wrong to tell people it's okay. It's not okay, a lot of people are going to die, and even more people would have died if we didn't take costly measures to stop it. This has been and will be the worst experience of a lot of people's lives, and it'd just be a lie in another direction to pretend that's not so.
What seems to be a noble lie is the apocalyptic mindset, where the coronavirus is literally the only thing that matters and we must never ask if a particular mitigation is worth the cost. Many authority figures are promoting this idea, even though they clearly don't believe it themselves and couldn't formulate effective policy if they did.
> even more people would have died if we didn't take costly measures to stop it.
The example of Sweden seems to disagree with this assumption. They never locked down, and the current mortality is (1,203 / 10,330,000) * 100 = 0.0116%
First case on Jan 31st, no lockdowns, death rate has already flattened. Where is that crazy scary exponential growth?
Sweden as the great success story when it is suffering the same economic devastation as its neighbors but a higher death rate is an interesting argument.
The thing about the lockdowns is that evidence so far indicates that stopping 80% of non-essential economic activities voluntarily is about as bad for the economy as stopping 90+% on a mandatory basis, but it seems that the health outcomes are much better in the latter situation.
I discount any comments that argue IFR as the sole basis for how quickly we can let the disease spread to save jobs on a short term basis.
Hospitalization is a more important factor as it the death count goes up dramatically without intensive care.
These comments always come with a healthy dose of "people aren't seeing reality!?!?", which is a bonus given the level speculation surrounding IFR and the variance therein.
> Around 200 million Americans will eventually get it, barring extraordinary events (like a vaccine arriving in 6 months). We cannot change this.
"Significantly less than 200 million Americans catching it" is still on the table.
"Herd immunity" is just the point at which the reproduction rate of the disease falls below 1 because the average infected person does not encounter anyone else to infect (because everyone else has already been infected) before they recover. It's not a binary switch, though -- as the percent of the population that has recovered grows, the reproduction rate shrinks steadily.
This means, for instance, that if we had X infected individuals before the lock downs, and then -- because we can't stay completely locked down forever -- we at some point have X infected individuals again after the lock downs end, we're actually in a much better place, because the reproduction rate of the disease is lower and that X will become 2X much slower than it would have before the lock downs.
This also synergizes with stay-at-home orders, which also reduce the reproduction rate of the disease. Right now we're relying entirely on stay-at-home to reduce the reproduction rate to as close to (or below) 1 as possible, but in a month or two, once a portion of the population has recovered, we'll be able to rely on a mix of "herd immunity" and stay-at-home to achieve the same thing; it's entirely reasonable that we can drag it out for years, and that less than 50 or 100 million Americans will catch it before a vaccine is developed.
It isn't hopeless.
> Around 0.5% will die, overwhelmingly those who had a low remaining life expectancy to begin with. This is a much larger body count than most people seem able to accept, but also much less dangerous to the average American than many believe.
We're currently losing 12-17 years of life per death, based on the statistics out of New York. It's older folks, sure, but it's hardly just taking people off their death beds.
This is a great comment, thanks. So isn't there an argument in favor of infecting more people sooner in order to increase the immunity rate of the population, particularly if those people are at lower risk of complications for the disease?
For example why not pursue a policy such as: kids can go to school unless they live with someone who is at risk (since we know that children are at very low risk for complications). Similar to how we managed chickenpox before there was a vaccine.
I think we need to explore alternatives to lockdowns because I believe the economics of lockdowns will make them impossible to continue for very long. At the moment people see this as a "be heroic and do the right thing" issues, but most people don't yet understand the severity of the economic impact and haven't yet been personally affected by it. Lockdowns will probably become politically untenable by May or June whether anyone today likes that fact or not.
Eh, it's kind of like the decision on how bags of groceries to carry from the car to the house at once -- it's faster the more you take, but the more you carry the more likely you are to drop them and the more catastrophic the accident becomes when it happens.
It's tricky to take large bites here because of the short doubling time compared to the relatively longer recovery time -- in the ~3 weeks it takes your currently-infected cohort to recover, your infected population could increase 100-fold if you aren't careful. Mistiming things -- misjudging how many people are currently infected -- by a couple of days can be difference between exposing 10% of your population to the risk and exposing 15%. There's a reason pandemics are often compared to forest fires.
This will get easier as time goes on, as the doubling period gets longer and longer.
Based on current estimates of how many people will die in the US, you can infer that we currently expect 5-10% of the population to be exposed in this first wave; I believe what widespread testing there has been in Italy leans towards about 10% of that population having been exposed there as well.
""isn't there an argument in favor of infecting more people sooner in order to increase the immunity rate of the population, particularly if those people are at lower risk of complications for the disease?""
Only if you would like to see the hospitals overwhelmed with cases that don't result in fatalities but kill lots of other people and also kill people with underlying conditions that would otherwise live full and productive lives.
Chicken pox was a steady state. It sucked that kids got it, but their parents and most adults were likely immune, so when they brought it home from school, it didn’t spread to parents.
But if you expose kids to COVID now, they will in turn expose their parents, who will expose their coworkers, etc, etc
I could see that being effective strategy if we didn’t have a vaccine in 30 years, but for now, most people are still susceptible.
>For example why not pursue a policy such as: kids can go to school unless they live with someone who is at risk (since we know that children are at very low risk for complications). Similar to how we managed chickenpox before there was a vaccine.
Because kids are the most likely to ignore even simple ways of preventing infection. Then you get exponential growth via kids and the health system implodes.
How does this square with Denmark, which is opening schools tomorrow? It's possible they're wrong, but they must at least have some reason to think what you're saying won't happen.
You don’t have a normal economy if people don’t want to go out in public or the supply chain is interrupted as workers get sick. A pandemic will harm the economy no matter what we do, these efforts, it is hoped, will reduce the impact while also saving lives and the hospital system.
What's your source for 2%? A recent study which was featured on Hacker News estimated the infection fatality rate at 0.66%. [1]
I have seen a number of studies putting the case fatality rate at 2-3%, but this number cannot be generalized to the entire population because current testing is skewed toward the most serious cases. [2]
Long-term mortality in the total population may look something like 0.66% * 0.7 assuming there are no advances in treatment (possible but unlikely, given the unprecedented efforts that are underway, and how naive we were on day one).
In general more recent studies estimating IFR should be more accurate, early ones came with a lot of caveats. If there is a better estimate of IFR than 0.66%, I would like to read it.
The CFR in Italy is nearly 13%. Even if you make incredibly generous assumptions that there are no unreported deaths and they're only catching 10% of cases that still leaves the infection fatality rate at twice the number you propose
That's almost certainly untrue. Recent studies have show that as many as 38% of the Italian population has been infected at this point [1]. That gives a fatality rate 0.03%. Let's say the official death count is 10x undercounting, you're still left with 0.3%.
Testing is severely undercounting cases here. People who just experience fever are told to self-isolate and aren't tested. Not all of these (luckily) end up hospitalized, so those are never, ever counted.
With an older population, a problematic medical system, and being caught totally unprepared, isn't Italy the worst case scenario? I don't think it would be representative of what's going to happen in other countries from here on out.
The US has a population riddled with comorbitities (obesity, heart disease, diabetes, etc.), a problematic medical system, and was caught totally unprepared. Isn't the US the worst case scenario, with the most deaths and most infections in the world?
I use the 0.66% number myself when estimating things, but it's worth noting that that is that papers best-guess estimated infection fatality rate for China, based on its demographics.
The paper has an overall estimate of the infection fatality rate for all ages of 0.2-1.6%.
And that also assumes everyone can get medical care, if all of the cases are happening at the same time, the mortality rate would increase as resource constraints force medical providers to pick who gets care.
No, 2% is the case fatality rate. The true overall mortality is far lower. Germany did a randomized test recently of a town and calculated that 2% of the population is actively infected, 14% possess antibodies indicative of a current/prior infection, and overall 15% have been infected at some point. Once this broader testing was completed, the overal mortality was found to only be 0.37%. For comparison, a typical flu season is 0.1%.
That is incorrect. The worst flu wave to hit Germany in the last 20 years, 2017/2018, killed appoximately 25000 people (excess mortality). That's 0.03%, and it's not typical. Often, the number is much lower.
Note also that the results from the Gangelt study you're referring to are preliminary; there's a press release but no paper yet, not even in preprint.
> That's 0.03%, and it's not typical. Often, the number is much lower.
0.03% or 0.1% or 0.66%, the number is low enough to be perceived as not too dangerous by general populace. Contrast that with 13% mortality rate for Italy that was widely spun a month ago. Now _that_ was scary!
Just in support of your argument, new data is showing that the fatality rate is lower then previously estimated, due to a large number of undetected cases.
I've seen a few more of these data points coming out, and nothing is 100% conclusive, all the new data points are showing that it's less bad than mainstream thinking suggests.
> Around 200 million Americans will eventually get it, barring extraordinary events (like a vaccine arriving in 6 months). We cannot change this.
We don't know that's inevitable. Korea, Japan and Taiwan suggest another outcome is possible, and while a vaccine may not arrive in 6 months, lots of other things might: better treatments, better masks, better testing, better tracing, etc.
> Around 0.5% will die, overwhelmingly those who had a low remaining life expectancy to begin with. This is a much larger body count than most people seem able to accept, but also much less dangerous to the average American than many believe.
Death isn't the only metric. A lot more than those dying will be the amount of people that are hospitalized in very serious shape. Some of them will have long-term damage, and some of them will die if the hospitals are overwhelmed.
> Around 200 million Americans will eventually get it, barring extraordinary events (like a vaccine arriving in 6 months). We cannot change this.
This doesn't seem right to me. With social distancing now, and testing and tracing once we have enough tests available, it seems to me that we should be able to keep the total number of infected people well below 200M, even if a vaccine takes the expected 18-24 months. If there's a solid argument that this is not the case, I'd like to hear it.
2) Testing and tracing is working fairly well in S. Korea because they're treating it like a war, and they've been orgainzed since fairly early on. The US is not organized.
What most people, including HN, miss is that passing a test today means nothing about tomorrow.
Based on Italian serological and all cause mortality data I have seen, the death toll would more likely be about 1.4%. 0.5 IMO is quite optimistic. 0.1% of New York's population has already died.
This also discounts the unknown possibility of disability, reinfection, and limited time immunity.
You're pointing out a great ambiguity in the state's graph. Is the hospitalization line a cumulative count of all hospitalizations? Or hospitalizations at any given time? Since the state's hospital capacity is related to hospitalizations at a given time, and not cumulative, I'm assuming the fit of that graph would be a bell curve with a max, followed by a decrease. People either die or leave the hospital.
Does anyone have the ability to walk through these explanations in a little more detail. I'm having trouble understanding why infections would be a bell curve, or derivative of a log curve.
So the basic assumption of an exponential growth curve is: "rate of change is proportional to a population."
However, in the case of a virus, you eventually run out of population to consume; so you tweak the model to be "Let the rate of infection be the probability that a infected person encounters a non-infected person" (nicely, for a large population, this will give you the same results initially). This is, approximately, proportional to the product of the number of people who are infected times the number of people who are not infected (think back to chemical reagents and reaction rates). That is, (1-infected(t)) * infected(t). A function who's rate of change is that is the logistic function (and you can verify by taking the derivative of 1/(1+e^-t))
This is a simple model, ignores geography, ignores population change, and ignores changing behavior. It basically pretends everyone is an ideal gas molecule in a volume. But if you want to model something that "grows exponentially with a limit" it works alright.
I don't know under what assumptions the rate of change would yield a bell (normal) curve. (e^-x^2).
Cumulative infections would not be a bell curve. They'd be a sigmoid curve, approaching some upper limit (e.g. 100,000).
Current Hospitalizations, which is the number we should be most concerned about, and is reflected by the orange dots on the state's graph, should start low, max out at a number, and eventually return to 0. That should follow something like a bell curve.
I think the confusion is between the "total infections" curve and the "current hospitalizations" curve. The difference between them is huge, and really important. The "Flatten the Curve" idea refers to keeping the number of hospitalizations at any one moment below some upper limit, ideally the state's number of available ICU beds. That's a bell curve.
the dotted line is what we would expect if the intervention is removed as of today. the red dots are actual hospitalizations as of right now. the blue line was the predicted line for hospitalizations... she mentions that we are doing better than the prediction as of right now. it was not altogether that clear but in the context of the press briefing it's more clear.
This is poorly designed graph because it can give the wrong impression when it isn't accompanied with the explanation that was given in the press conference. I am not usually one to make a "this should be higher" comment on HN, but this is the proper interpretation and lots of people are being misled by not seeing it.
The light blue curve, labeled "With Intervention", is an upward-facing concave curve. Even if it were linear, it does not align with the observed data referenced in the link labeled [2].
OK, looking at the new cases curve on your covid-19.direct page. As presented, you can't really see what the green curve is doing. If you remove the black, total curve, the green new case curve is visible but it seems to be going up and down fairly inconclusively. Until 4/1, it looks like exponential growth. After that, it goes down and then up. Sure, the optimistic view is it's plateaued or going downward and I hope that's true but counting on just twelve days of data seems foolish.
"If you remove the black, total curve, the green new case curve is visible but it seems to be going up and down fairly inconclusively."
The best fit line of new cases after 4/4 is a linear function with a definitively negative slope. It is conclusively not a function that contributes to the upward, concave blue line on the state's graph.
Who cares what the best fit is. There is simply not enough data. You're talking twelves data points with considerable variation. Using statistic doesn't turn muddy and ambiguous data into a clear signal magically.
Sure, but I think they are tracing the worst case scenario based on the underlying assumption that the virus increases exponentially.
What going to happen is indeed inherently uncertain so we pretty much have to prepare for the worst plausible series of events. Once it becomes clear that a better outcome is fairly likely, then the plans can shift.
Can you trust that data to be perfectly comparable? Testing capacity ramped up at a different rate than cases. Testing guidance has been spotty too. The days right after increases in testing access could be very noisy.
I would look to the deaths curve much before the new cases curve, even though it's less responsive to changes. I assume fewer deaths have slipped through the cracks (though I'm sure some have).
What bothers me the most is that the comparison is always against a hypothetical "do nothing" strategy, ignoring the fact that different countries have employed different strategies, some of them have been highly successful in containing the disease without any lock down (Korea, Taiwan, and Australia) come to mind.
"some of them have been highly successful in containing the disease without any lock down (Korea, Taiwan, and Australia) come to mind."
How are you defining lock down here? I live in Australia and most people I know have been working from home for weeks and have had kids out of school during that time. All restaurants have been closed for a while now. There are stops/checks at border entry points between states, even at points 1-2 hours in from the border, enforced quarantine for anyone arriving interstate. Weddings restricted to 5 people, funerals to 10. People are getting fined $1k+ for non-essential travel (group of kids this week copped big fines for getting up and congregating to see the sunrise).
At almost every "essential" business I've visited, there have been spacing markers on the floor. Supermarkets have plastic shields between the checkout operator and shopper. Gloves, hand-washing, etc at any food pick-up place I've seen.
I don't favour our current leaders at either state or national level, but since Morrison's Hillsong weekend, he's barely put a foot wrong. Senior politicians have been serious and escalated restrictions as appropriate (ignoring Ruby Princess). I'm sure there are more serious levels of lock down, but it's been part of the response in Australia.
I wish this was the situation here. The limitations in most of Europe and united states are much much harsher, including no schools and mandatory closure of all non-essential business.
Schools have closed in one Australian state at least. More than half of children are at home in my home state, from what I can tell, where schools are not closed. They've polled for the coming term and suggest that two-thirds will be at home.
One serious loss in productivity comes in overseeing homeschooling while trying to work from home. Can't imagine many non-essential businesses are running anywhere near 100%.
Most of Europe hasn't closed all non-essential businesses. Has anyone, aside from Italy and Spain? Non-essential public venues (gyms, museums, some stores, etc) are closed, but that's true in Australia, too.
Aren't the techniques that Taiwan and Korea have employed (testing, isolation of known cases, contact tracing) irrelevant at this stage of contagion? I doubt of the efficacy of contact tracing when you have enough of a percentage of population infected that a single visit to Costco or any other supermarket would mean a very high chance of being there at the same time as an infectious person...
I think that the answer is that we don't know what's the effect of each measure. The fact that Japan & Australia did not employ contact tracing, but also managed to contain the spread shows that there are other factors at play. It might be face masks use, or temperature (for Australia), but it does show that there are potential alternatives that could be viable.
That makes you think it should be a bell curve? Are you arguing it will be a bell curve with such a peak, even if restrictions are weakened or removed? That is unlikely.
I am not. I am arguing that the current trajectory data we're observing [2] does not align with the projections of our current trajectory provided by the government of California (the light blue line labeled 'With Intervention' [1])
But you wrote "meaning that the graph of active hospitalizations should be a bell curve with a maximum value of ~10,000 on ~4/20."? You didn't mean that?
I meant that "the graph of active hospitalizations should be a bell curve with a maximum value of ~10,000 on ~4/20" with the current mitigations in place. That is not what the government report is projecting. They're projecting unbounded, exponential growth with current mitigations in place, even though that is not in line with the data we've seen over the past two weeks.
Also the hospital bed line that many draw are all based upon having medical staff for them. So does somewhat depend upon no staff shortages due to illness impacting capacity of hospital bed numbers.
This plan also ignores the question of the majority of people who have likely been infected with no symptoms that could be identified with widespread Serology/Antibody tests. I find it alarming that this plan ignores that, is the governor priming is for population wide vaccination that is likely to be unnecessary? If we confirm widespread recovery and immunity then larger numbers of people can get back to life as usual quite soon.
The plan ignores that because people working on this are consistently finding infection rates of less than a few percent. Stanford tested 2888 samples that were negative for flu and other respiratory viruses and didn't find any positive for SAR-COV2 until Feb 21st and Feb23.
There could be some limitations in sampling. Multiplex respiratory panels at Stanford that come up negative for everything... what does that patient look like?
A source for what you are saying is the linked SF article [1] which indicates that of ~3k evidently sick people with flu symptoms, 0.1-1% were confirmed to have COVID-19. Though note this is not random population sampling, on an interesting scale, so ignores asymptomatic question. Worldwide analysis of death rates [2], indicates #infected-so-far = 700-1600 x #dead so far. And data from Iceland [3], the only country with widespread sampling of asymptomatic population, is aligned with these numbers. Based on the analysis and support from Iceland, Covid-19 testing to see if patients actively have the disease are likely inaccurate and also a policy of only permitting testing of severe symptom patients is depressing reported numbers of once infected.
[2] Analysis of #infected today from #dead today, using following assumptions:
1. death statistics are reliable, since cause of death tests can adequately collect fluid samples (a major source of inaccuracy in COVID-19 testing), source = talking to medical staff at Bay Area sites.
2. E[days between first infection and death] = 14 (lost the source at the moment),
Therefore, number of dead today D => number of infected 14 days ago = 100 D
3. rate of death increase consistently trends around 25%/day or 15% with full lockdown, source CDC situation reports worldwide excluding regions with restricted access to journalists
4. therefore, #infected today = #infected 14 days ago growing at 25% daily = 22X, or 7X if your region was locked down for last 2 weeks
5. so #infected=2200D or 700D
[3] Last week, CDC reported 2 deaths today for Iceland, and admittedly-non-random sampling by DeCode indicated upto 1% of population have/had virus, upto 3600. Iceland has done strict quarantining of confirmed and suspected cases, and extensive testing since February, so despite no lockdown, I would put them at the 700X end of the estimate. They report ~1000 confirmed cases, so they would actually estimate 3600-1000 infected so far. My estimate would have indicated 2200-700 X D (= today's deaths, 2) = 4400 to 1400 cases.
Well, Gangelt showed 15% had antibodies (subject to, potentially fair criticisms re: methodology) so I think it's fair to say it varies by locale.
While I understand that many folks from Wuhan travel all over the United States, the non-stop options from Wuhan to NYC and, if I recall correctly, SFO and LAX meant that more opportunities existed for early spread than the middle of Colorado. In fact, I can't actually pinpoint a city in San Miguel County, Colorado -- can you? (https://goo.gl/maps/F7CJ3yfDKaf1gQjDA) I guess there's a post office in Egnar... Telluride maybe?
Certainly the sparse population created natural social distancing precluding its spread.
The mismatch between their models and the observed data does not engender confidence.
[1] https://www.gov.ca.gov/wp-content/uploads/2020/04/California...
[2] https://covid-19.direct/state/CA